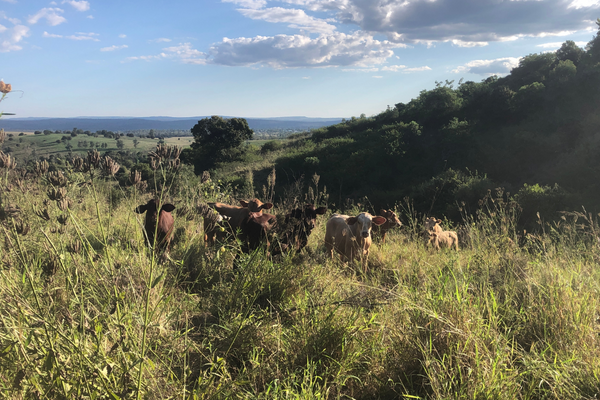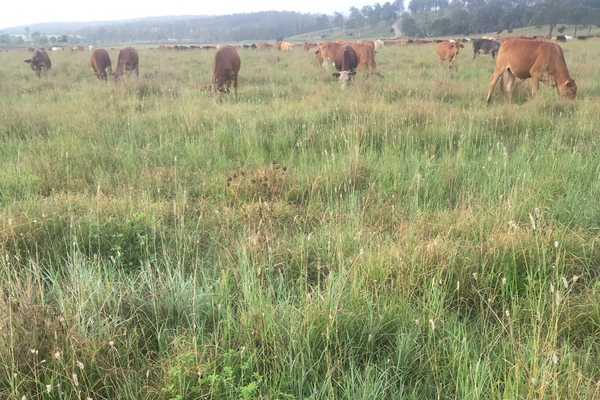
Dennis Donohoe, farm manager with Aminya Pastoral, is a seasoned producer with decades of experience, and his story is a testament to how even minor changes in farming practices can lead to significant improvements in productivity and land health.
It doesn’t matter what industry we are in, there are some basic skills relating to that industry that we need to be brilliant at, to be outstanding. In the grazing industry, one of those skills, and I’d argue the most important skill to master, is the grazing chart.
Now there is a bit to unpack in this sentence.
Our benchmarking platform Profit Probe consistently shows over the past 25+ years, that the average Grazier in economic terms is spending more than they earn in at least half of those years. Put another way, 50% of years the average Grazier is making a profit and in 50% of years they are making a loss. Whereas the top 20% of Graziers, are continually generating good profits in every year. So don’t be shy, aim for outstanding.
Big call! However, when we look at only the first three grazing principles, Grazing Charts have a pivotal role in each of thes
By itself, the Grazing Chart is only monitoring tool, capturing what has actually happened on a paddock basis and also at a whole farm level. When we are disciplined in doing the math to calculate how many DSE, Days per Hectare (DDH) or Stock (in LSU), Days per Hectare (SDH) our animals have eaten in each graze, we are learning to get our eye in to budgeting feed.
Think of it this way. When we weigh animals, with the first few running across the scales our estimates are out, but within half a dozen or so we get our eye in and are able to estimate fairly closely what weights each animal is going to be showing on the screen. The same with estimating feed. We make a guess in DDH or SDH and then within half a dozen paddock shifts and calculating what the animals have removed, again in DDH or SDH, we get our eye in and are able to guess fairly accurately how much feed we have going forward. To be a Master Grazier, accurately estimating feed is one of those basic skill to be brilliant at.
Mastering this skill and then using the same methodology, we can plan forward. Anyone relying on tropical species will be aware that our growing season is rapidly coming to an end. Those that have missed out on rain need to be looking at what feed you have now and what the plan is going forward though winter. Some of you will have had some rain and will still get some growth before it slows down. While others are having a cracking season with a good body of feed. So, remember as Mike Tyson once said, a plan is good until you get punched in the face, therefor we need to manage and adjust to the current reality.


We all know that our pastures grow at different speeds depending on available moisture and temperature. We need to be aware that with diverse pastures, individual species within each paddock may grow at different speeds, therefor it’s important to be focusing on what we want and adjust rest period to suit those plants we are wanting to support. The top part of our Grazing Chart is a beautiful visualization of what is happening with rest. The question we need to ask ourselves is, are we giving the appropriate amount of rest, depending on moisture, temperature and pasture mix? In other words, when we are having fast growth, are we having fast moves (shorter rest periods)? And we when we are having slow growth, are we having slow moves (longer rest periods)?
First things first. Stocking Rate is the animals that we put on a piece of country, a property, a paddock. The amount of feed that these animals eat, we measure in either DDH or SDH.
Carrying Capacity is the amount of feed that we grow, depending on moisture, temperature, pasture species and soil health. The amount of feed we grow that we are happy for our animals to eat, we also measure in DDH or SDH.
We all know that some years we grow a heap of feed, and some years we don’t. This principle is about adjusting the number of standard animal units in DSE or LSU, our stocking rate, to match the amount of feed we are growing, our carrying capacity.
On our Grazing Chart, this is calculated in row 38, expressed in DDH/100mm or SDH/100mm. By using our rolling rainfall in this equation, we are accounting for the reality that at any point in time it is either getting wetter, or it is getting drier. Sometimes, though rarely it stays about the same. This is based on my own experience having looked at many, many Grazing Charts across the country over many, many years.
We can plot our Stocking Rate (wriggly line) and Carrying Capacity (straight line) on a graph using DDH/100mm or SDH/100mm. This third principle says to adjust our Stocking Rate to match our Carrying Capacity. When we say match, we are meaning if we can get our Stocking Rate within about 10% of our Carrying Capacity, that is pretty good. If we get above that 10% of our Carrying Capacity, we need to be asking some questions. What has made it go up? Is it likely to be coming back down soon? What do we need to do? I’ll add further that we need to take action if haven’t already, when we get 20% above, or if we are in the third consecutive month above our Carrying Capacity and our Stocking Rate is still rising.

I’m wanting to make a note here about the last few years. A number of you will have had big wet years, with rolling rainfall double or more what your long-term average rainfall is. In these really big wet years, our graph will probably be showing that we are way understocked. While on paper we are understocked, what is the reality in the paddock? Has all that rain been effective in growing grass? In most cases it hasn’t. Therefor we need to keep looking at what is happening in the paddock and what is our Grazing Chart trying to tell us. Sometimes our Grazing Chart can give us a heads up of what is likely to happen, and other times our paddocks can give us a heads up before the Grazing Chart.
Hopefully I’ve been able to highlight the importance of filling in a Grazing Chart. It’s not the Grazing Chart itself, but the meaningful information you can get from it, to make informed decisions as a professional manager. The ability to estimate feed with confidence, have a plan going forward and destocking in a timely manner, if necessary, are all decisions that can be made based on that basic skill around Grazing Charts.
If you have been keeping your Grazing Chart, filling in all sections, and then using that information to make informed decisions, well done! I congratulate you.
If you haven’t been filling in all sections, or you’ve let it slip, or have never started a Grazing Chart, I’d like to give you some encouragement. Seriously, it is like learning a new language. It is not easy in the beginning and there are very few people who go home from a Grazing Clinic or a Grazing for Profit school and start their own chart without some help.
I had an old bloke the other day comment, that the good seasons that have been around in some areas, has made everyone a good grass manager in those areas. If you’re wanting to be a good, no let’s change that to an outstanding grass manager, here are some ways that we can help you get your Grazing Chart up and running and be brilliant at the basics:
• Face to face, one day Grazing Chart Refresher in Murgon 19 April, supported by BMRG. This is a hands on, step by step, fill in your grazing chart and go home with your chart up to date, all sections filled in.
• How to videos on the RCS Learning Hub
• One on one consult, either on farm or remote. We have a big team of advisors able to help across the country
• If unsure what to do call the office 1800 356 004
There is an element of art to interpreting a Grazing Chart. If you want someone to check your benchmark carrying capacity, or check your chart, or help you work out what your chart is trying to tell you, call the office and book an hour with one of our advisors. Remember that a small action taken sooner, is a lot easier and less painful than leaving it unattended.
Be brilliant at the basics, you outstanding grass managers.
Author:

Teacher, Advisor, Facilitator and Coach
Profitable Paddocks is our educational newsletter sent to your email inbox every quarter.
Click the Bell for the latest blogs.

Dennis Donohoe, farm manager with Aminya Pastoral, is a seasoned producer with decades of experience, and his story is a testament to how even minor changes in farming practices can lead to significant improvements in productivity and land health.
Once you have ownership as to why planning is important, the next ingredient is to work out where and how you will do your planning. When you write something down you change your relationship with the content. I cannot emphasise enough the power of getting your thoughts and plans out of your head onto paper or the computer.
The season in SA and Tassie is particularly tight right now with little or no useful rain since early January and a generally failed 2023 spring prior to that. Right now, across southern Australia and much of the eastern NSW, you won’t need to drive far out into the countryside to see cattle and sheep grazing (and lying on) hay and silage trails lined across paddocks.
Martha Lindstad and partner Robert James are farm managers on ‘Karalee’, Enngonia NSW. Both have travelled different paths to being where they are. Martha is originally from Norway, growing up on a three hectare farm before travelling to New Zealand and eventually the Pilbara in Western Australia. It was here that she saw the benefits of sustainable farming for the country and livestock.
The Prince’s RCS mentor, Raymond Stacey, sees a strong future ahead for Simon and Laura. “The Drought Resilient Soils and Landscapes project is about supporting graziers to manage their country and businesses better,” Raymond said. “I see an operation here where they’re working hard on their planning and putting their plans into action to leave their country, business and people in better shape.”

Join our mailing list
